METRICAL:Corporate Governance Rating of Japan’s 1,800 companies (June 2019)

“Policy Stockholdings”
Many companies set the fiscal year to end at the end of March and hold their AGM in June. Those companies file Yuho financial reports by the end of June. According to the Yuho reports, we are able to lots of new data at this time. Among the data, in this post we will focus on ”policy stock” holdings, also known as “allegiant shareholdings”.

The average holding of “policy stocks” was JPY34,861 million for 1,775 companies, which has come down 13.7% from JPY40,389 million a year as the average of the 1,794 companies in our universe. Of course, we should carefully analyze these numbers, but the decrease of the stock holding was larger than the change in the stock index Topix for the same period. The Topix fell 7.3% from 1,716.30 on March 31 2018 to 1,591.64 on March 31 2019.

“Linkage Between Corporate Governance and Value Creation” (METRICAL/BDTI) – Update as of January, 2019

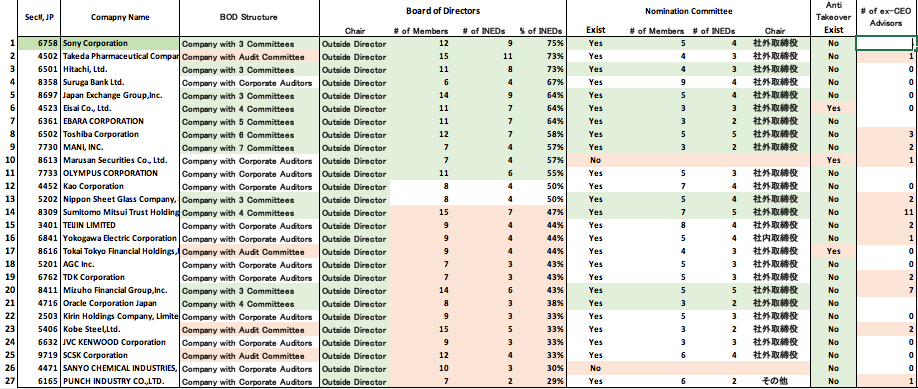
Our joint research – “Linkage Between Corporate Governance and Value Creation” – between BDTI and METRICAL has been updated as of January 31. The most important inferences are summarized below.

(1) Correlations: Board Practices
and Performance

Significant correlation between board practices and performance continues.

(a) ROE: Nominations Committee existence, the number of female directors and percentage of INEDs show a significant positive correlation.

(b) Tobins Q: Nominations Committee, retired top management “advisors” (ex-CEO “advisors”), and percentage of INEDs show significant positive correlation.

(c) ROA (actual): Compensation Committee existence (negative correlation), Incentive Compensation Plan disclosure, and retired top management (ex-CEO) serving as advisors show significant correlation.

Corporate Governance of Japan – Linkage Between CG and Value Creation (October 2018)

BDTI/METRICAL updated their research series on “Corporate Governance in Japan – Linkage Between CG and Value Creation” as of October 2018. The joint research has analyzed how board practice criteria and action criteria statistically correlate with value creation measures such as ROA, ROE and Tobin’s Q.  An increasing number of criteria or factors of CG show statistically significant correlation with ROE, ROA and Tobin’s Q.  Also, the analysis of the correlation between the percentage of INEDs and the performance measures revealed a J-curve relationship (layered structured, in three groups).  We will keep a close eye on how board practice and actions impact on performance.

Japan CG Top20 Stock Performance: Gap with Market Indices Widens (August 2018)

CG Top 20 stocks continued solid performance in August

August stock prices have continued low trading volume. Topix and JPX400 indices tumbled in the middle of the month, but recovered toward the month end. Meanwhile, CG Top 20 prices also recovered their losses toward the end of the month. The gap between CG quality stocks and the market indices is widening. The stock price charts for in the indices and the composite of CG top 20 companies are shown in the following link.

BDTI Update to Supporters, June 2018

Notes: (1) On this page (at top right), you can sign up to receive our English Newsletter; (2) Sign up to receive the (separate) Japanese Newsletter here; (3) Anyone can support the “SEO” of our web site simply by mentioning BDTI on any web page with a link to this page; (4) For details about the chart, see the overview materials.

” Dear Supporter:   I am writing to update you, and to respectfully ask you or your institution to make a donation of 300,000 Yen or more this year, either as a Sustaining Donor or as a Corporate Participating Member. (As explained below in section 5, the latter category now allows donors which are investing institutions to receive 40% discounts on all BDTI courses/seminars that are open to the public, and to share these discounts with companies in their portfolio.)

BDTI/METRICAL CG Research Update: “Linkage between CG Practice and Value Creation”

BDTI and METRICAL collaborate on researching the linkage between CG practices sand value creation. We have recently released our updated analysis as of April 2018 for the roughly 1,800 publicly traded companies with market capitalization exceeding about JPY10 billion.

In this analysis, by examining board practices (CG guidelines, practices, and composition of the Board of Directors) and specific actions (real actions by a company) separately, we try to identify statistically significant correlations with financial performance measures (ROE, ROA, Tobin ‘s q) for each of these respectively – i.e, for, board practices and action respectively.

We have observed a certain degree of improvement in board practices since the introduction of the Corporate Governance Code.  However, assuming that one of the key goals of the corporation is value creation, in order to improve the effectiveness of engagement and stewardship it is very important to regularly analyze the way in which such improvement (and specifically, which improvements) appears to lead to value creation.

We can summarize the results of our recent analysis as follows: