By Ken Hokugo[2]
Director, Head of Corporate Governance, Pension Fund Association
Director, The Board Director Training Institute of Japan
There has always been confusion surrounding this topic. From the point of view of those who want to help foreign investors understand the realities of the Japanese market, the most troubling number that is thrown about is the seemingly magic number of “10% or less”. This number is frequently referred to by the media, with the source given as being the reports by a certain analyst at a research institute that is affiliated with a prominent securities firm.
Quite often, we encounter foreign investors who casually believe this widely-touted number of “10% or less” and therefore are not concerned very much (if at all) with the issue of “cross-shareholdings” in Japan, in light of recent improvements in Japan’s corporate governance. Needless to say, it takes a lot of energy to convince such investors that the reality of the Japanese market is different. In this post, I am not trying to scare foreign investors away from Japan’s stock markets, but rather trying to encourage them to invest based on an accurate understanding of the situation in the context of history, culture, and the overall current environment.
1. How is the magic number of “10% or less” calculated? Please refer to page 20 of the Financial Supervisory Agency’s (“FSA”) official “Material” prepared for the “The Council of Experts Concerning the Follow-up of Japan’s Stewardship Code and Japan’s Corporate Governance Code”, dated October 18th, 2017[3]
s
 Source: “Progresses of Corporate Governance Reform”, Financial Services Agency, October 18th, 2017.
s
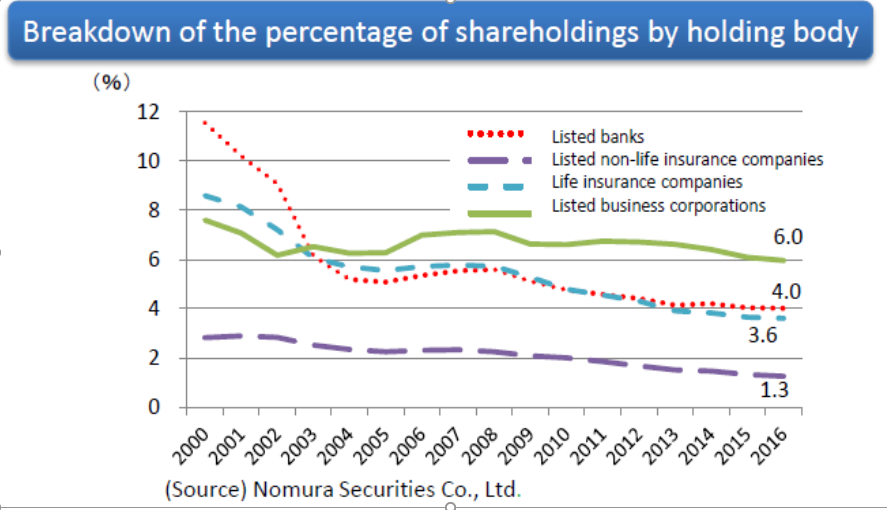
The magic number of“10%” is not fake or false, but it is definitely misleading. One has to read the fine print of what is included in that percentage and what is not, to get the full picture. For instance, the 10% number is based on:
- “Term-end market value”, rather than the “number of votes”
- Including only what listed general corporations and listed banks hold
- Excluding what insurance companies hold, whether they are public companies or mutual organizations
- Excluding holdings by “parent companies” which hold more than 20% of other listed companies
- Excluding, further, the holdings of the company’s own shares by those “subsidiaries” (whether listed or not). You can easily see from Toyota’s shareholder’s list on Bloomberg that 22.2% of Toyota’s shares are held by the “Toyota Group” including Toyota itself and those “Group Companies”.
So the calculation excludes a lot, and that is why it is “10% or less. How the analyst came up with these numbers is academically interesting but it is not very relevant for the purpose of this paper. Also, the case of “parent-subsidiary dual listings” requires deeper analysis, but I will not attempt that in this post.
Now you can see that although this number is not false, in terms of promoting corporate governance improvement, it is misleading and unhelpful. Based on the way it is calculated and the explanation in the research paper presenting it, the green solid line group “Listed general corporate” held 6% of the market value of all holdings, and the red dotted line group “listed banks” held 4% of total holdings, and thus the widespread magic number 10% emerged. It is pretty clear that this number is not very useful for analyzing the real impact of “allegiant shareholders” and shareholder composition on corporate governance in Japan.
2. What are excluded from this “10%”?
Aside from the fact that this number is expressed in as a percentage of total market value, it does not include:
- Unlisted general corporations – General corporations of many types, e.g. thousands of mid-size or small suppliers.
s - Holdings of insurance companies. Most life insurance companies claim that all of their holdings are “purely for investment purposes”, rather than “policy holdings”. These holdings represent the investment of insurance reserves to prepare for the future payouts on policies. There is no clear-cut answer as to what proportion of their equity holdings are purely for investment purposes and what proportion seek to support business relationships, but it is a fact that the same names of life insurance companies have been on the “major shareholder list” of many companies for a very long time. Since most of the major life insurers have signed the Stewardship Code and are therefore required to disclose their voting results, over time it will become clearer to what extent they are “allegiant shareholders”. Some life insurance companies do disclose how they voted, in accordance with the Stewardship Code. This includes Dai-Ichi Life, the only listed life insurance company in Japan, as well as Sumitomo Life and Meiji Yasuda Life. But the ratio of their “against” votes is only a few tenths of 1% of all the agenda items they voted on. The largest life insurance company in Japan, Nippon Life (Nissay), doesn’t even disclose. As for the property and casualty insurers, most are listed companies and as such they at least disclose the total holdings and top 30 individual holdings that are not “purely for investment purposes”.
s - What parent companies hold when they hold 20% or more of a listed company. There are approximately 1000 companies out of 3500 listed companies for which 20% or more of their shares are held by another company (including those unlisted ones). This number is staggering, and of course such holdings are problematic for corporate governance. Although the number is said to be declining, there is a worrying trend in the world to relax the rules for “parent-sub” listing. Minority shareholders like asset owners should continue to monitor such activities and voice their displeasure where it is warranted.
s - Listed Parents’ shares held by their subsidiaries.
s - Shares quasi-transferred to the corporate retirement pension plan. The amount of these is approximately JPY10 Trln, or USD100 Bln, equivalent of 1.5% of the total market value of the TSE. The beneficial (economic) interest in these shares is transferred to the pension plan as a contribution by the sponsor company so that the funding level is maintained even though the company retains the voting rights. (In fact, these are disclosed on the Financial Report (Yuho) as “Quasi-held shares”.)
s - The holdings of Foundations or trusts that re related to the company or the founders’ family.
3. What counts is the number of the votes, not the market value.
As mentioned, the number this paper has discussed so far is based on “market value”. On each company’s Financial Report (Yuho, similar to 10-K), the number of shares the company holds and the book value is listed. But when the effect on corporate governance is discussed, it is the number of the votes held by different investor that is important, not the market value. For example, it has been said for some time that 30% of Japan’s stock markets is held by the foreign investors, but in terms of voting rights, foreign investors “own” only 16%.
Let me try to explain this in simple terms. JPX does publish the number of shares held by foreign institutions in its annual statistics, in the “Shareholder distribution Statistics 2017” on its website. According to those statistics, as of the fiscal year end of FY 2017 (March, 2018), foreign institutions held 26.6% of the all shares. So, what is the difference between this “26.6%” and our number of “16%”? It’s simply the result of using a different calculation method. While the JPX number is simply “the total number of shares across the exchange held by foreign institutions, divided by the total number of outstanding shares across the exchange”, our method is based on “the total number of the shares held by foreign institutions in each company, divided by the total number of outstanding shares of each company. We then calculate the simple average of this ratio as calculated for each company, by dividing their aggregate total by the number of listed companies. This is because when discussing the corporate governance, it is important to know the status at individual companies, and in a sense the total market value across the entire exchange is irrelevant.
4. What are the real numbers?
This question has always been controversial because there is no clear-cut definition of “allegiant holder” in the public statistics collected by any agency. The “major shareholders” section of Financial Reports (Yuho) only shows the top 10 holders, whose identities typically are masked by custody bank names. What is needed is the true identities of the end-investors and how they voted during their holding period. The Pension Fund Association (“PFA”) attempted to make serious calculations about this in cooperation with Japan Investor Relations and Investor Support, Inc. (“J-IRIS”). The method used was quite cumbersome, mostly manual checking by the naked eye based on more detailed databases on shareholder composition as provided by various vendors. Without describing the process in detail, the conclusion of the exercise was that at least 35% of shares are held by “Allegiant Shareholders”. This did not take into account the shares held by individuals and the like – founders, founders’ family members, board members, employee shareholding associations, affiliated foundations, etc. So, the implication of the conclusion might be that around 50% (more or less) are held by those “Allegiant Shareholders”. These numbers are from FY2015, but the situation, sadly, has not changed that much since then.
5. Other shockingly revealing data.
Now, let’s return to the FSA’s official “Material” dated October 18th, 2017. On the same page 20, the lower left hand graph shows the result of the annual survey conducted by the Japan Institute of Business Law which has been conducted for decades after each major AGM season. This particular question of the survey – “what percentage of your shareholders do you expect to support the company? ” – is directed to the persons responsible for the AGM, meaning those persons responsible for counting the votes. They know exactly who the “friendly / supportive” shareholders are. Therefore, the result of this survey is, although admittedly less scientific, actually the most accurate summary of status quo of shareholder composition in Japan.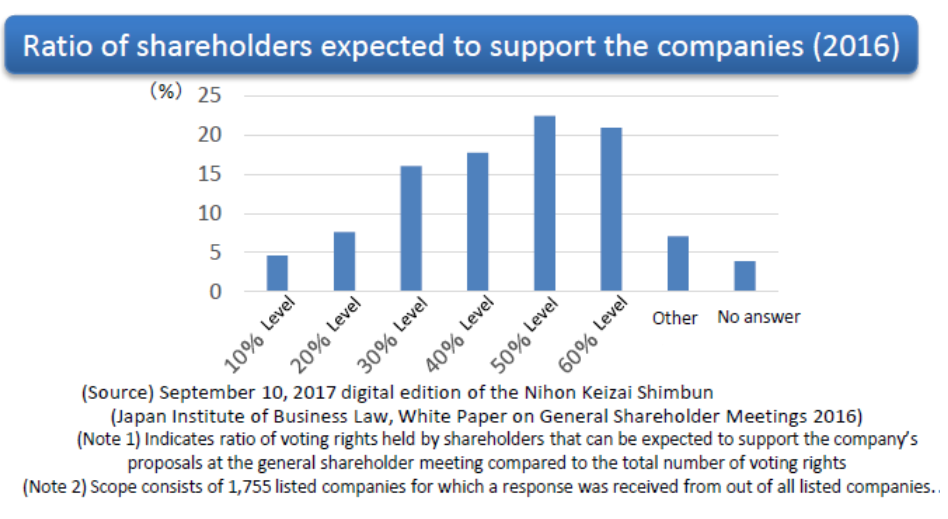 Source: “Progresses of Corporate Governance Reform” October 18th, 2017 – Financial Services Agency.
a
As you can see, the largest group of respondents (23% of them) replied “50% level”, and the next largest group (21%) responded “60% level” . In total, almost half of those companies which responded said that 50% or more of their shareholders are “supportive” investors. Coincidentally or not, these results are very consistent with the calculations by PFA/ J-IRIS. If you understand the true impact of this staggering figure, you may want to revise your perception of the status quo of Japan’s corporate governance, what is wrong with it, and what to do about it.
Needless to say, this topic will be a major focus leading up to the 2019 AGM season.
[1] Those shareholders who have or intend to hold the Company’s shares for indefinitely for business reasons, thus always vote for the management. Unlike ordinary minority shareholders, they receive additional benefit from holding the shares, but it is hard to submit evidences therefore no one has ever challenged in light of “equal treatment of all the shareholders” principle in court.
[2] The opinions expressed in this report are solely those of the author and do not represent the opinions of any organizations with which the author is affiliated.
[3] See: https://www.fsa.go.jp/en/refer/councils/follow-up/
https://www.fsa.go.jp/en/refer/councils/follow-up/material/20171018-1.pdf
Comments